
Interaction to Next Paint (INP) measures how quickly your pages respond when someone clicks, taps or types. On WordPress sites, a poor INP score rarely comes from WordPress core. It usually comes from the JavaScript that themes, page builders and third-party tools add on top.
This guide explains what INP measures, how to find the interactions that are slow on your site, and which fixes make the biggest difference.
The Short Answer
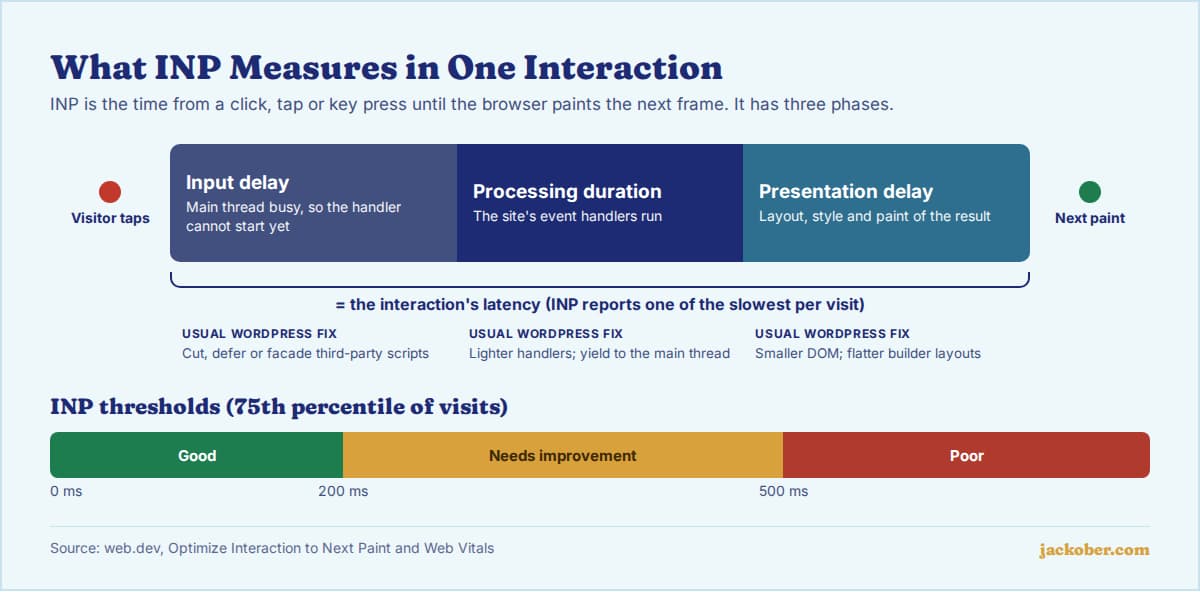
INP became a Core Web Vital on 12 March 2024, replacing First Input Delay. A good INP is 200 milliseconds or less at the 75th percentile of visits; above 500 ms is poor.
To improve it on WordPress: confirm the problem with field data in Search Console or PageSpeed Insights, find the slow interaction in Chrome DevTools, then reduce main-thread JavaScript. In practice that means removing or delaying heavy third-party scripts (chat, tag managers, consent banners, ads), loading scripts with defer, trimming plugins that add front-end JavaScript, and simplifying page-builder layouts that create very large pages.
What INP Actually Measures
INP observes every click, tap and key press during a visit and reports one of the slowest. Each interaction has three parts, and each points to a different kind of fix:
| Phase | What happens | Typical WordPress cause |
|---|---|---|
| Input delay | The browser is busy and cannot start handling the click yet | Scripts still loading or running: analytics, ads, chat widgets, sliders |
| Processing duration | The site’s event handlers run | Heavy handlers in menus, filters, popups or add-to-cart buttons |
| Presentation delay | The browser recalculates layout and paints the result | Very large pages (deeply nested builder sections), big DOM updates |
The common thread is the main thread. Any task that runs longer than 50 milliseconds counts as a long task and can block the next interaction.
INP depends on real visitors, their devices and what they click, so lab tests alone can mislead. Start with field data:
- Search Console: the Core Web Vitals report groups similar URLs and shows the INP that 75% of visits achieved over the last 28 days. Check mobile first; it is usually worse.
- PageSpeed Insights: the top section shows Chrome UX Report data for a single URL or the whole origin, if your site has enough traffic.
If you see “not enough data”, your site does not have enough Chrome traffic for public field data. You can still test interactions manually in the lab, as below.
Step 2: Find the Slow Interaction
Field data tells you which page templates are slow, not which button. To find it, follow Google’s guide to diagnosing slow interactions in the lab:
- Open the page in Chrome, open DevTools and go to the Performance panel.
- Turn on CPU throttling to approximate a mid-range phone.
- Click the elements real visitors use: the mobile menu, search, accordions, filters, add to cart, cookie banner buttons.
- Record the slowest interaction and look at which scripts run during it. The file path usually names the plugin or theme folder.
Step 3: Apply the Fixes That Matter Most
Reduce third-party JavaScript
Third-party scripts compete for the same main thread as your site. Google’s guidance on tags and tag managers notes a correlation between larger tag manager containers and poorer INP. Audit your tag manager and remove tags nobody uses.
For chat widgets and video embeds, use a facade: a lightweight placeholder that loads the real widget only when a visitor clicks it. Consent banners matter too; one consent platform’s published case study reports that the share of its customers’ mobile origins passing INP rose from 13% to 55% after it optimised its script.
Load scripts with defer
Since WordPress 6.3, developers can register scripts with a defer or async loading strategy. If you maintain a theme or plugin, use it for scripts that are not needed immediately:
wp_enqueue_script(
    'my-theme-menu',
    get_theme_file_uri( 'js/menu.js' ),
    array(),
    '1.0',
    array( 'strategy' => 'defer', 'in_footer' => true )
);
Deferring mainly helps loading, but it also reduces the chance that an early tap lands while a large script is executing.
Be careful with “delay JavaScript” options
Many caching and optimisation plugins can delay scripts until the first interaction. That can improve load metrics, but every delayed script then runs at the moment of the visitor’s first tap, which can make that interaction slow. Test INP with the option on and off; exclude scripts that power menus and buttons above the fold. Our comparison of WordPress cache plugins covers where these settings live.
Break up long tasks in custom code
If your own code does heavy work in an event handler, update the screen first and do the rest later. Google recommends yielding to the main thread with scheduler.yield(), with a setTimeout fallback for browsers that do not support it yet.
Keep the page smaller
Presentation delay grows with page complexity. Page builders make it easy to nest sections, columns and inner containers many levels deep. Flatten layouts where you can, and avoid loading hidden content (mega menus, off-canvas panels, tabs) that duplicates large parts of the page. Our guide to WordPress page builders compares how much markup each one tends to produce.
Diagnosis Table: Symptom to Fix
| If you notice… | Likely cause | Then try |
|---|---|---|
| The first tap after the page loads is slow, later taps are fine | Scripts still running, or delayed scripts firing on first interaction | Defer non-critical scripts; exclude menu scripts from “delay JS” |
| The mobile menu or search opens slowly | Heavy theme or builder JavaScript | Check the handler in DevTools; switch to a lighter menu or update the theme |
| Accepting the cookie banner is slow | Consent script triggers many tags at once | Update the consent tool; load tags gradually after consent |
| Add to cart or product filters are slow | AJAX handlers and large DOM updates | Show feedback immediately, then update; reduce products per page |
| Every interaction is slow on long pages | Very large DOM | Flatten builder layouts; paginate or lazy-render long lists |
| Only pages with ads or chat are poor | Third-party scripts | Facades for chat; review ad density and ad script settings |
Common Mistakes
- Judging INP from a Lighthouse score. A standard Lighthouse run loads the page without clicking anything, so it cannot measure INP. Use field data and manual interaction tests.
- Adding another optimisation plugin. Stacking several plugins that minify, combine or delay scripts often adds conflicts rather than speed.
- Testing only on a fast desktop. INP problems show up on mid-range phones; throttle the CPU when testing.
- Expecting immediate changes in Search Console. The report uses a 28-day window, so improvements appear gradually.
INP is one of three Core Web Vitals; for loading speed and layout stability, see our WordPress page speed optimization guide and our article on lazy loading in WordPress.
FAQ
What is a good INP score?
200 milliseconds or less at the 75th percentile is good, 200 to 500 ms needs improvement, and more than 500 ms is poor. Google explains how these thresholds were chosen.
Does INP affect Google rankings?
Core Web Vitals are part of the page experience signals Google describes in its Search documentation, but Google also says good page experience does not outweigh relevant, helpful content. Treat INP as a user experience fix first.
Can a caching plugin fix INP?
Page caching speeds up server response, which mostly helps loading metrics. INP is about JavaScript running in the browser, so caching alone rarely fixes it. Script deferral settings can help or hurt, depending on configuration.
Why is my INP fine on desktop but poor on mobile?
Phones have slower processors, so the same JavaScript takes longer to run. Mobile layouts also rely more on interactive elements such as hamburger menus and off-canvas panels.
Do popups hurt INP?
They can, if the popup script is heavy or runs when visitors click. Choose a lightweight tool and limit triggers; our review of WordPress popup plugins covers options.
The Bottom Line
Improving INP on WordPress is mostly about doing less JavaScript work at the moment a visitor interacts. Confirm the problem in field data, find the slow interaction in DevTools, then cut or delay third-party scripts, defer what you control, and simplify heavy layouts. Re-measure after each change so you know which fix helped.
Sources & Further Reading
- web.dev: Interaction to Next Paint is officially a Core Web Vital
- web.dev: Web Vitals
- web.dev: Optimize Interaction to Next Paint
- web.dev: Optimize long tasks
- web.dev: Manually diagnose slow interactions in the lab
- web.dev: Best practices for tags and tag managers
- web.dev: Lazy load third-party resources with facades
- web.dev: PubTech consent platform INP case study
- Search Console Help: Core Web Vitals report
- Google Search Central: Understanding Core Web Vitals
- Make WordPress Core: Registering scripts with async and defer in 6.3
Jackober uses AI tools for research, drafting, and editing. Articles are editorially reviewed and factual claims are checked against cited sources. Last reviewed: October 2026.